
Your data is collected, your analysis is done, and the results chapter is still a blank document three weeks before your deadline — because nobody told you that an education dissertation’s results chapter needs two different presentation skills, not one: tables and figures for whatever you measured, and a themed narrative for whatever people told you, and mixing the two up is what makes this chapter the hardest to start. Many UK education dissertations use a mixed-methods design, which means many students are trying to learn both skills at once, under deadline pressure, with no worked model to follow.
Step 1: Work out which kind of results you actually have
Most education dissertations produce one of three result types, and each needs a different presentation approach:
- Quantitative results (test scores, survey Likert-scale responses, attendance or attainment data) — present these as tables and figures, with descriptive statistics stated in the text.
- Qualitative results (interview transcripts, classroom observation notes, open-text survey responses) — present these as named themes, each developed with a short narrative and supported by direct quotes.
- Mixed-methods results (a widely used design in UK education dissertations) — present both, usually in separate sub-sections, with a final section that explicitly brings the two together.
Whichever design you used, your results chapter’s job is to present what your methodology chapter promised it would produce — see our guide to writing the methodology chapter of an education dissertation if you need to check your results actually match the design you described there.
Step 2: Build your quantitative tables and figures properly
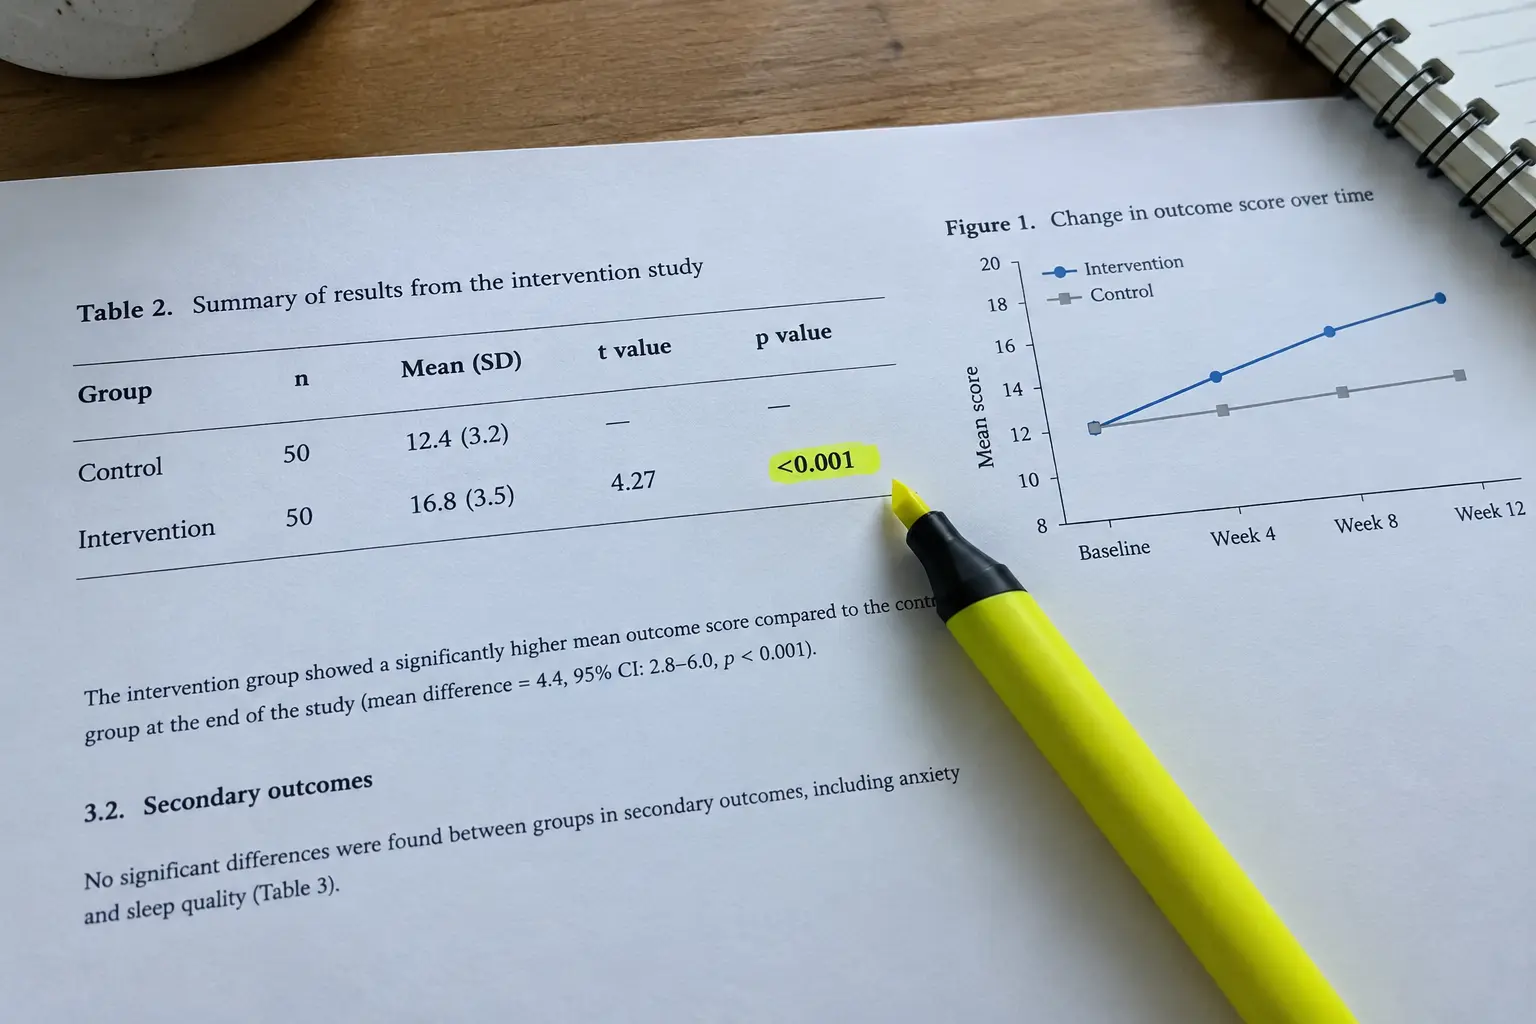
A results table needs a number and a title placed above it (the APA convention many education departments expect), and every column labelled with its unit. State descriptive statistics (mean, standard deviation, or median and range for non-normal data) in the text before or after the table, not only inside it — a marker should not have to open the table to know your headline finding. If you ran a statistical test, report the test statistic, degrees of freedom where relevant, the p-value, and an effect size, not just “the result was significant,” which on its own tells a marker nothing about the size of the effect.
Step 3: Present your qualitative themes with structure, not just quotes
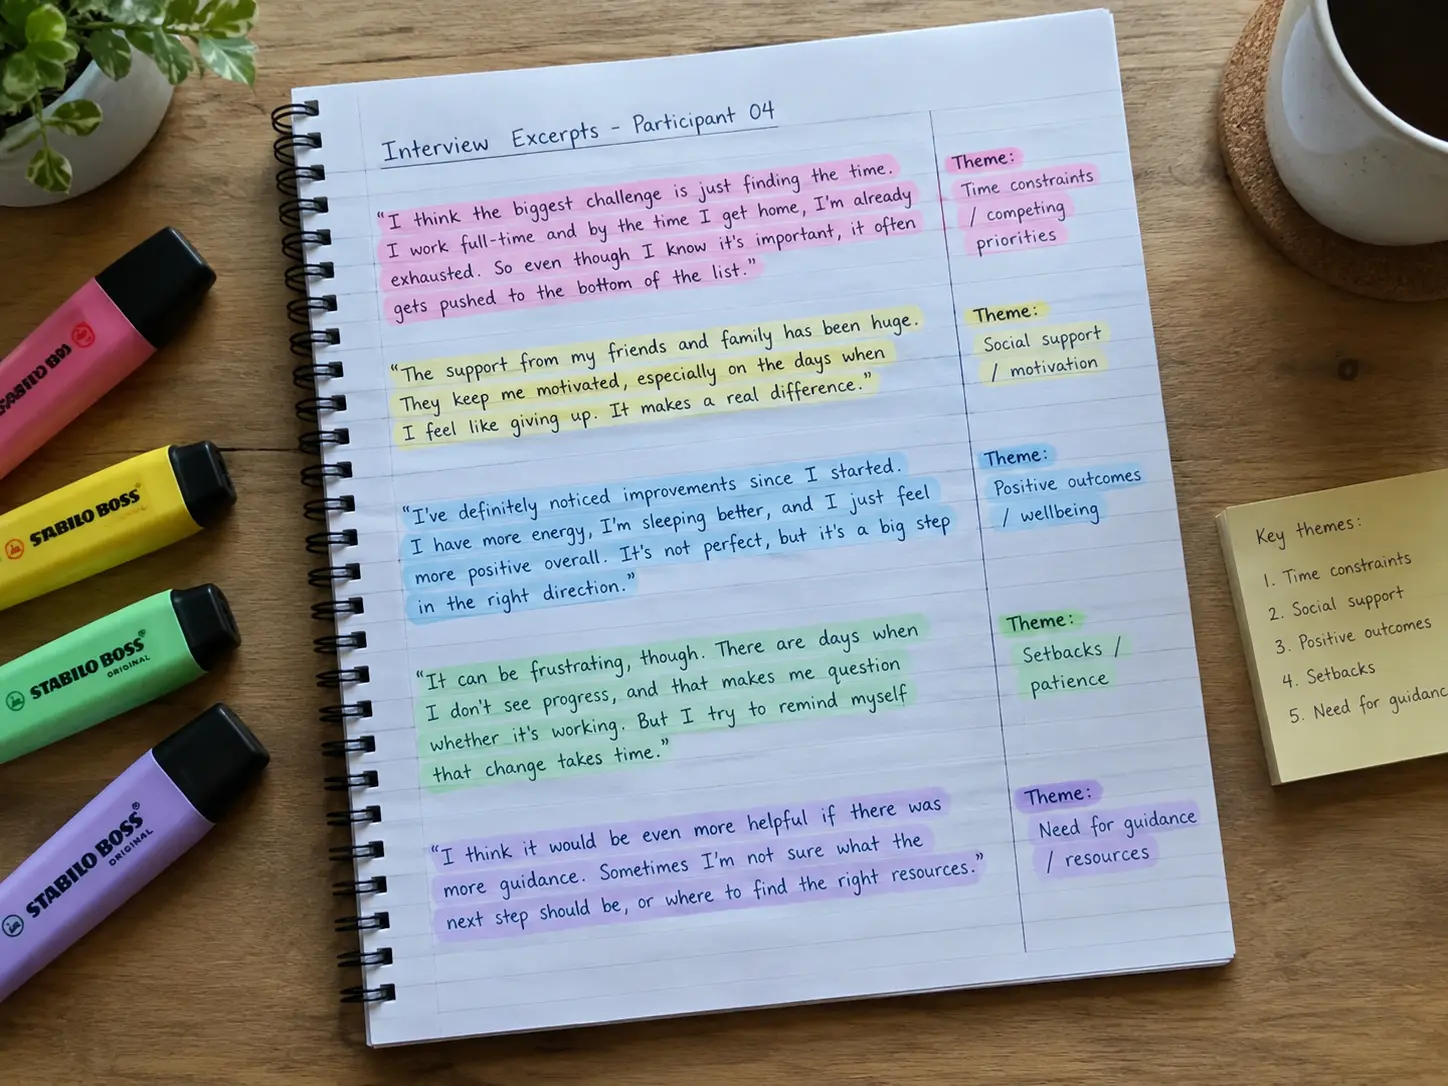
A qualitative results section built entirely from a list of quotes with no analytical commentary between them is a transcript excerpt, not a findings section. For each theme: name it clearly, state in one sentence what the theme captures, then support it with two or three carefully chosen quotes with brief analytical commentary connecting each quote back to the theme. A theme named “Teachers’ views on assessment” is too broad to be useful; “Teachers experienced formative assessment as time pressure competing with curriculum coverage” is specific enough that a marker knows exactly what claim you are making before reading a single quote. If your data comes from an action-research cycle rather than a single data-collection round, our guide to action research as your education dissertation covers how findings are typically presented cycle by cycle.
Step 4: Bring mixed-methods results together explicitly
If your design mixed quantitative and qualitative data, do not simply present both types and leave the connection implicit. A short integration section (or an integration sentence at the start of your discussion) that states where the two data types agree, where they diverge, and what the qualitative data explains about the quantitative pattern (or vice versa) is what actually demonstrates a mixed-methods design was worth doing, rather than two separate studies stapled together.
Step 5: Match your results structure to your research questions
Organise your results chapter around your research questions or objectives, not around your data collection instruments. A chapter structured as “Survey results, then Interview results, then Observation results” forces the marker to reconstruct which data answers which question themselves; a chapter structured as “Research Question 1 (survey + interview data together), Research Question 2…” does that connecting work for them, and is worth real marks at the point findings are assessed against objectives.
A quick reference: what goes where
| You have… | Present it as | State in the text |
|---|---|---|
| Pre/post test or attainment scores | A table with means and standard deviations, or a bar/line chart for trends over time | Descriptive statistics, the test used, statistic, p-value, effect size |
| Likert-scale survey responses | A table of percentages/frequencies per item, or a stacked bar chart | The headline pattern in one sentence before the table |
| Interview or focus-group data | Named, defined themes with supporting quotes | A one-sentence definition of each theme before the quotes |
| Classroom observation notes | Themes or a structured framework (e.g. by lesson phase), often paired with a frequency count of observed behaviours | What was observed, how often, and in what context |
| Open-text survey responses | Either coded into themes (if substantial) or summarised briefly alongside the closed-question results | How many responses contributed to each theme |
A worked example (illustrative)
An illustrative, labelled example: a mixed-methods dissertation on formative assessment presents its results in three sub-sections matching its three research questions. Under Research Question 1 (do attainment gains differ between classes receiving frequent and infrequent formative feedback), a table reports pre/post attainment scores by feedback-frequency group, with the difference in mean gain, an independent-samples t-test statistic on the gain scores, p-value and Cohen’s d effect size stated in the text immediately below. Under Research Question 2 (how do teachers experience delivering frequent feedback), three named themes are presented, each with a one-sentence definition and two supporting quotes with analytical commentary. Under Research Question 3 (how do the quantitative and qualitative findings relate), a short integration paragraph states that the attainment gain was concentrated in the group whose teachers reported the theme “feedback as a planned routine rather than an add-on,” linking the two data types explicitly rather than leaving the connection for the reader to infer.
Common mistakes in an education results chapter
- Reporting statistical significance without effect size. “p < .05” alone does not tell a marker how large or educationally meaningful the effect is.
- Presenting quotes with no analytical commentary. A quote needs a sentence explaining what it demonstrates about your named theme, not just its presence on the page.
- Structuring by instrument instead of by research question. This leaves the connecting work for the marker to do, which costs marks even when the underlying analysis is sound.
- Leaving mixed-methods integration implicit. State explicitly where your quantitative and qualitative findings agree, diverge, or explain each other.
- Table titles below the table, or missing units. Check your department’s required style (commonly APA) for table formatting conventions before your final draft.
- Confusing results with discussion. Our generic guide to writing a dissertation results chapter covers the results-vs-discussion boundary that applies across every subject, education included.
Checking your chapter against your ethics approval
Before you finalise any quote, table or observation excerpt, check it against what your ethics approval and consent forms actually permitted — a quote that reveals a participant’s identity through detail rather than name, or a table that reports a subgroup so small it effectively identifies someone, is a breach even without a name attached. This check takes a few minutes per theme and is far cheaper to do now than to discover after submission.
How Tesify helps you build this chapter properly
Tesify guides you through structuring your results chapter around your actual research questions, section by section, prompting you to state descriptive statistics in the text, name and define each qualitative theme clearly, and write the mixed-methods integration explicitly rather than leaving it implied — every draft is 100% written by you, working through your own data with the platform’s structure as the scaffold, not a generic template dropped over whatever you happened to collect.
Objection-handling FAQ
Does using Tesify to structure my results chapter count as academic misconduct?
Every Tesify draft is 100% written by you, guided section by section through the platform — you remain the author of your analysis and interpretation throughout. Check your own university’s academic integrity policy on AI tool use and disclose your use of any tool exactly as that policy requires.
Is my data safe if I use an AI writing tool for my results chapter?
Handle any genuinely sensitive or personally identifiable data (raw interview transcripts, identifiable survey responses) according to your own university’s data protection and ethics approval requirements regardless of which writing tool you use — anonymise data before working with it in any external tool, consistent with your ethics application.
Should I present quantitative or qualitative results first in a mixed-methods chapter?
Match the order to your research questions’ own order, or to which data type was collected first in a sequential design — there is no universal rule, but the order should be justified by your design, not arbitrary.
How many quotes should I use per theme?
Two or three well-chosen, clearly analysed quotes per theme usually demonstrate the theme more convincingly than five or six unanalysed ones — quality and analytical commentary matter more than quantity.
Do I need to report every statistical test I ran, even non-significant ones?
Report all tests relevant to your research questions, including non-significant results — selectively reporting only significant findings misrepresents your actual analysis and is a form of results manipulation examiners are trained to spot.
What effect size measure should I use?
This depends on your specific test (Cohen’s d for mean comparisons, r or eta-squared for others) — check what your statistics module or supervisor expects, and be consistent throughout your chapter.
Can I put all my tables in an appendix instead of the results chapter?
Key tables that support your main findings should stay in the chapter itself; supplementary or very detailed tables (full descriptive statistics for every survey item, for example) can go in an appendix, referenced clearly from the main text.
How do I name a theme well?
A good theme name states a claim, not just a topic — “Time pressure” is a topic; “Formative assessment competes with curriculum coverage under time pressure” is a claim a reader can evaluate against your evidence.
What is the difference between the results chapter and the discussion chapter?
The results chapter reports what you found, organised and presented clearly; the discussion chapter interprets what those findings mean in relation to your literature review and research questions — keep interpretation out of the results chapter itself unless your department’s convention combines the two.
How does my theoretical framework relate to my results chapter?
Your results chapter reports findings; the framework’s job is usually to organise your discussion chapter’s interpretation of those findings, not the results chapter itself — see our guide to theoretical frameworks for an education dissertation for how eight commonly used frameworks structure that interpretive work.
Should I use participants’ real names or pseudonyms in my quotes?
Use pseudonyms, consistent with your ethics approval and consent process — never real names, and check whether your ethics application requires any further anonymisation (school name, specific year group) before including identifying detail in a quote.
How long should each theme’s write-up be?
Long enough to define the theme, present supporting evidence, and analyse it — typically a paragraph or two per theme, though this varies with how central the theme is to your research questions; a theme central to your argument deserves more space than a minor, secondary one.
What is the single biggest mistake in an education results chapter?
Structuring the chapter around your data collection instruments instead of your research questions, which leaves the marker to do the work of connecting your findings back to what you actually set out to answer.
Tesify has helped over 9,000 students write more than 15,000 dissertation chapters, and every draft is 100% written by you, guided section by section. Start your education dissertation results chapter with Tesify and work through your tables, themes and integration section properly structured from the start.