Tag: thematic analysis

  • Your Data Is Analysed and the Results Chapter Is Blank: How to Write It This Week (2026)

    Your Data Is Analysed and the Results Chapter Is Blank: How to Write It This Week (2026)

    The analysis is done. There is a folder of output, a set of tables you cannot bring yourself to look at, and a chapter heading with nothing underneath it. Two weeks ago the problem was getting the data; now the problem is that nobody ever taught you how to turn output into prose — and this is the chapter that, with the discussion, carries roughly 40% of your word count and most of the analytical credit. You can start building the chapter in Tesify tonight, free; first, here is why it will not start.

    The reason it will not start

    You are trying to write the chapter from your output. A results chapter is written from your research questions.

    Statistical software and coding software both produce material in the order the software works, which has nothing to do with the order your argument needs. Open the output folder and you are looking at a list of procedures. Open your methods chapter’s list of research questions and you are looking at a chapter outline — because your results chapter has exactly one job: to answer, in order, each question you said you would answer, with the evidence that answers it.

    That single reframe removes most of the paralysis, because it converts an unbounded writing task into a fixed number of small ones.

    The cost of getting this chapter wrong

    Two failure modes, and both are expensive.

    The narrated-output chapter. Every table reproduced, every number restated in a sentence, no signal about which finding matters. It is long, it feels thorough, and it reads to a marker as an inability to distinguish the important from the incidental. It also consumes the words the discussion needed.

    The chapter that leaks its discussion. Findings interpreted as they appear, so that by the time you reach the discussion there is nothing left to say and you restate. This is the more common of the two, and the harder to repair late, because unpicking interpretation from reporting means rewriting both chapters.

    The proportion matters as well. Results and discussion take roughly 20% each of a typical empirical dissertation, as our breakdown of undergraduate dissertation word counts sets out. A results chapter that has swollen to a third of the dissertation has taken those words from the chapter that earns more of them.

    Figures arranged in the order of the research questions they answer
    Sort the output by question before you write a word. What is left over is an appendix.

    Step 1: Sort the output into three piles

    Print or list every piece of output you have and put each item into one of three piles.

    1. Answers a research question. This is your chapter, and it is usually smaller than you fear — three questions might need five tables.
    2. Describes the sample. Response rates, demographics, missing data, reliability figures. This is the short opening section, not the body.
    3. Everything else. Exploratory runs, checks you did and abandoned, alternative specifications. This goes in an appendix, or nowhere.

    The third pile is where most over-length results chapters come from, and cutting it is not hiding anything: an analysis you ran, did not preregister and do not report as answering a question belongs in an appendix with a line in the text saying it is there.

    Expected output: a numbered list of sections, one per research question, with the specific tables or themes that belong in each.

    Step 2: Write the sample section first, because you already know it

    It is the easiest thing in the chapter and it breaks the blank page. How many people you approached, how many responded, who they were, what was missing, and any reliability or assumption checks. Facts you already have, in the past tense.

    If your achieved sample fell short of your target, this is where you say so and where you carry the consequence forward — the honest construction, including the sensitivity analysis that replaces a post-hoc power calculation, is set out in our guide to sample size for an undergraduate dissertation. Stating the shortfall in the results chapter and revisiting it in the discussion is a mark of competence, not a confession.

    Expected output: 300–500 words on the desk, before you have interpreted anything.

    Step 3: One sentence per table, then the table

    This is the rule that turns output into a chapter. Each table or figure gets one sentence of prose before it that says what it shows, and one sentence after it, at most, that points at the specific value the reader should notice. Nothing else.

    The University of Manchester’s Academic Phrasebank describes exactly this convention for quantitative work: results are presented with “tables and figures, and writers comment on the significant data shown in these”, and “more elaborate commentary on the results is normally restricted to the Discussion section”. Its worked phrasings are the ones to imitate — “Table 1 shows an overview of…”, “As can be seen from the table (above), the X group reported significantly more Y than…”, and the summarising move “The most striking result to emerge from the data is that…”.

    Two things this rule prevents. It stops you retyping the table into prose, which is the single commonest padding in an undergraduate dissertation. And it stops the table from arriving unannounced, which is what makes a results chapter feel like a report dump.

    Expected output: a chapter whose prose can be read on its own and still makes sense, with every table introduced.
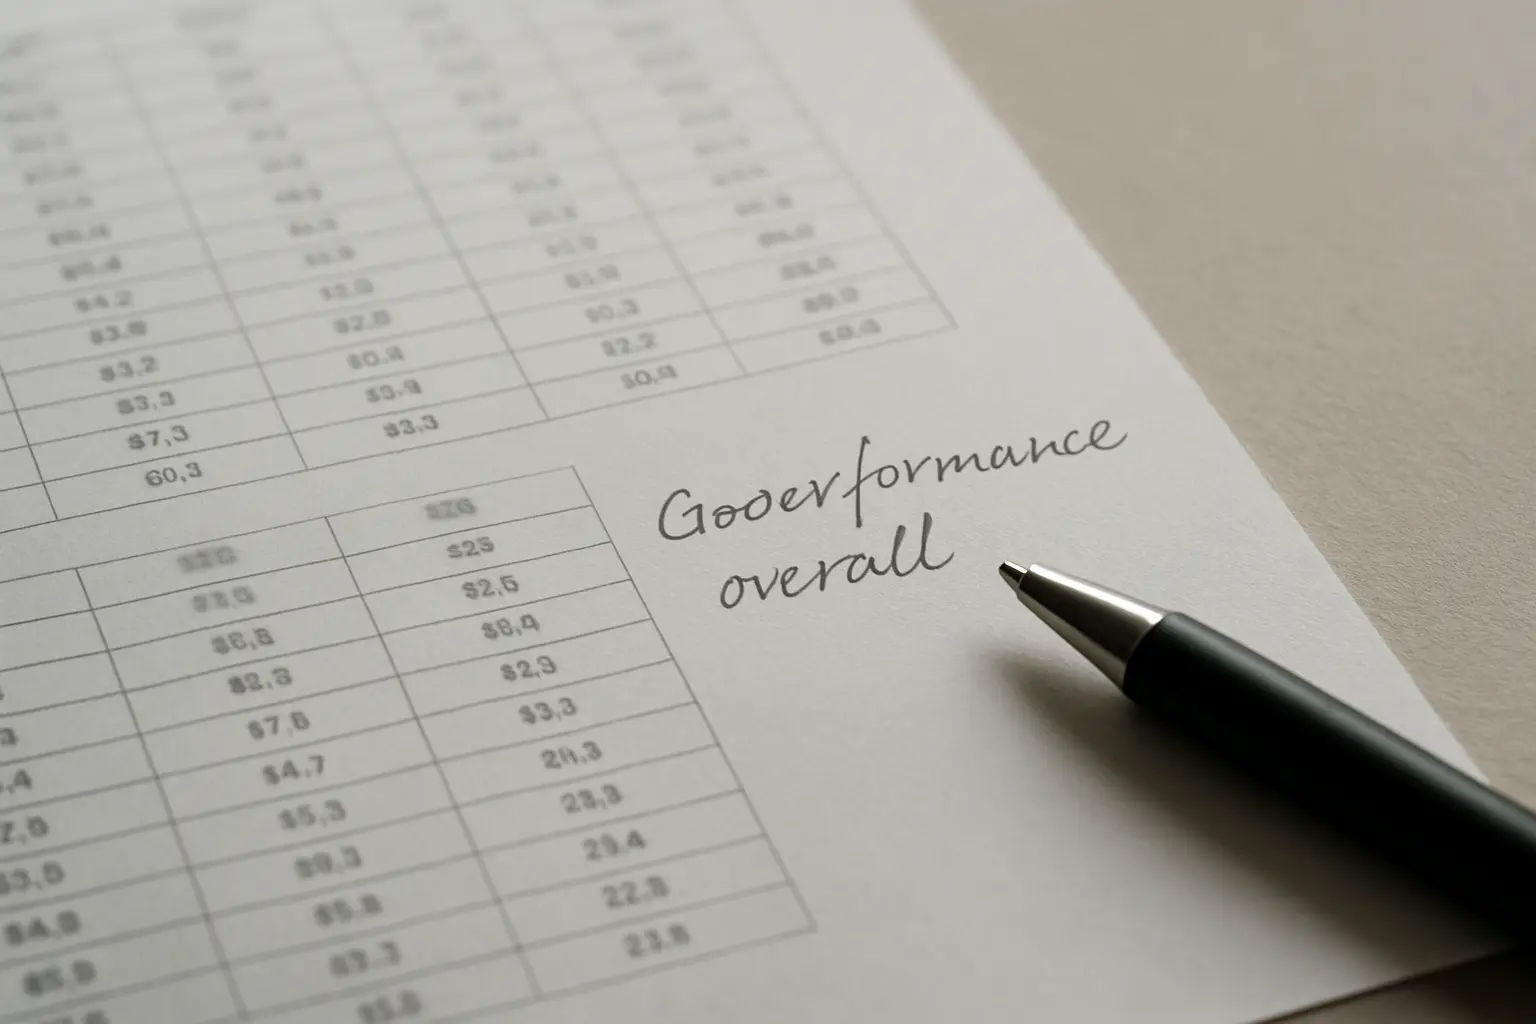
    A results table annotated with the single sentence that will introduce it in the chapter
    Write the sentence in the margin first. If you cannot say what the table shows in one line, the table is doing too much.

    Step 4: Report the numbers in the conventional form

    Reporting conventions are not decoration; they are how a marker checks your analysis quickly. The Phrasebank’s own example gives the shape: “There was a significant difference in X, t(11) = 2.906, p<0.01” — test statistic, degrees of freedom, value, then significance, in that order and in one bracketed string.

    Three habits raise the mark on this alone. Give an effect size alongside every significance test, because a p value tells a reader whether an effect is detectable and not whether it is large. Report exact p values where your handbook allows it rather than only thresholds. And report a non-significant result in exactly the same form as a significant one — “No significant differences were found between…” is a finding, written as a finding. The mechanics for individual tests, including how the output maps to the reported string, are worked through in our guide to running and reporting an independent-samples t-test in SPSS, and what to do when a test’s assumptions are not met is in our guide to failed statistical assumptions.

    If your work is qualitative, the equivalent conventions are structural. The Phrasebank describes qualitative results as highlighting themes with supporting excerpts, which in practice means: name the theme, state how it presents across the dataset, then give one or two illustrative extracts with a participant identifier. The full sequence, and where analysis stops being coding, is in our guide to doing a thematic analysis. The one rule that transfers from the quantitative side without modification: an extract is evidence for a claim you have already made in your own words, never a substitute for making it.

    Step 5: Hold the line between results and discussion

    The test is simple and you can apply it to any sentence you have written. If the sentence could be checked against your data, it belongs in results. If it requires the literature, an explanation, or a judgement about importance, it belongs in the discussion.

    “Attendance was lower among students travelling more than 45 minutes” is a result. “This suggests that practical constraints rather than motivation explain disengagement” is a discussion. The second sentence is more interesting, which is exactly why it migrates into the results chapter if you let it.

    Some departments explicitly combine the two into a single “findings and discussion” chapter, particularly in qualitative and case-study work. That is a legitimate structure and it is a decision your handbook makes, not you. If it does combine them, the discipline still applies inside each section: report first, interpret second, visibly.

    Step 6: Read the chapter backwards against your questions

    Take your list of research questions and, for each one, find the sentence in the results chapter that answers it. If you cannot find one, the chapter has reported around the question without landing on it — the commonest reason a marker writes “descriptive” in the margin. Write the missing sentence.

    Then check the reverse: every section in the chapter should map to a question. A section that maps to nothing is pile three, and it belongs in the appendix.

    Expected output: a one-to-one mapping between questions and answers, which is also the skeleton of your discussion and your conclusion.

    Writing it with Tesify, concretely

    The mechanical part of this chapter is real and it is where the week goes: holding a fixed structure while you fill it, keeping table numbering and cross-references consistent, and making sure the claims in the chapter still match the abstract and the conclusion when you have finished moving things around.

    That is the division of labour Tesify is built for. You give it your research questions and your own findings; it holds the chapter structure, keeps the bibliography built from what your text actually cites, and keeps the document consistent as it grows, so the chapter you finish on Thursday still agrees with the introduction you wrote in March. Every word is written by you — the analysis, the interpretation and the judgement about what matters are the assessed parts and they stay yours.

    Open your results chapter in Tesify now. It is free to start, and the first thing it will ask you for is the list you built in Step 1.

    Frequently asked questions

    How long should a dissertation results chapter be?

    About 20% of the total on a conventional empirical dissertation, with the discussion taking a similar share. On a 10,000-word limit that is roughly 2,000 words. Your handbook’s allocation, where it gives one, overrides the convention.

    What is the difference between results and discussion?

    A results statement can be checked against your data; a discussion statement requires the literature, an explanation or a judgement about importance. The Academic Phrasebank puts the same line as “more elaborate commentary on the results is normally restricted to the Discussion section”.

    Should I include every table my software produced?

    No. Include the output that answers a research question or describes the sample; put the rest in an appendix with a sentence in the text saying it is there. A results chapter is a selection, and making the selection is part of what is being assessed.

    How do I report a non-significant result?

    In exactly the same form as a significant one, without apology. “No significant differences were found between…” is a finding. What you must not do is run further tests until something reaches significance, which is an integrity question rather than a writing one.

    Do I interpret findings in the results chapter?

    Only to the extent of pointing at what the reader should notice. Save explanation and comparison with the literature for the discussion — unless your department requires a combined findings-and-discussion chapter, in which case still report before you interpret within each section.

    How do I write up qualitative findings?

    Name the theme, state how it presents across your dataset in your own words, then give one or two illustrative extracts with participant identifiers. Extracts support a claim you have made; they do not make it for you.

    Is it cheating to use an AI tool to write my results chapter?

    It depends entirely on what the tool does and what your department permits. A tool that holds structure, formats citations and checks consistency while you write the words is a different thing from one that generates findings, and only the second misrepresents authorship. Read your assessment brief’s AI statement, disclose what it asks you to disclose, and keep the interpretation yours.

    How much does Tesify cost?

    It is free to start, which is the tier most students finish a dissertation on. Paid options exist for longer projects; you do not need one to build a results chapter this week.

    Is my unpublished data safe in a writing tool?

    Your work stays yours, it is not published or shared into any public database, and you can export it. Separately, and regardless of tool: report anonymised or pseudonymised data in your chapter, keep identifiable material out of any document you sync, and follow the conditions of your own ethics approval.

    My results are not what I hypothesised. Is that a problem?

    No. A well-designed study reporting an unexpected or null result is a pass; the marks are in the design, the analysis and the honesty of the reporting. What costs marks is a discussion that pretends the prediction was confirmed.

    Where do tables and figures actually go?

    Inline, immediately after the sentence that introduces them, unless your handbook says otherwise. Numbered sequentially, with a caption above tables and below figures at most institutions, and listed on the list of tables or figures in your preliminary pages.
  • How to Do a Thematic Analysis for Your Dissertation: The Six Phases, Step by Step (2026)

    How to Do a Thematic Analysis for Your Dissertation: The Six Phases, Step by Step (2026)

    You have eight interview transcripts, a highlighter, and a methods chapter that says “thematic analysis” as though that settled something. It does not. Thematic analysis is the most commonly used qualitative method in UK undergraduate dissertations and the most commonly done badly, because most students learn a six-step recipe without ever learning which version of the method they are cooking.

    This guide walks the six phases as Braun and Clarke set them out, with the expected output of each step stated so you can tell when you have finished it. It also covers the decision that has to come first, and the single error that costs more marks than all the others combined. If your analysis is done and the chapters are the bottleneck, you can structure and draft them in Tesify.

    Step 0: Decide which thematic analysis you are actually doing

    Braun and Clarke are emphatic that thematic analysis is “a family of methods, not a singular method — there is no ‘standardised TA’”. In their 2022 paper on good practice they set out a typology, and knowing where you sit in it is what stops your methods chapter contradicting itself:

    1. Reflexive TA — the version Braun and Clarke themselves developed. Researcher subjectivity is treated as a resource rather than a bias to be eliminated. There is no notion of “accurate” coding, and no second coder checking your work.
    2. Coding reliability TA — emphasises objectivity, structured codebooks and intercoder agreement, usually reported as a statistic such as Cohen’s kappa.
    3. Codebook TA — including framework analysis and template analysis; structured procedures combined with qualitative research values.

    The mistake Braun and Clarke call out by name is mashing these together: running a reflexive analysis and then bolting on a second coder and a kappa value because it sounds rigorous. They describe that as methodological incoherence, and a marker who knows the literature will read it as exactly that. Pick one, name it in your methods, and behave consistently.

    Expected output of this step: one sentence in your methods chapter naming your variant and citing the source you followed. For most undergraduate projects that sentence is “This study used reflexive thematic analysis (Braun and Clarke, 2006; 2022).”

    Phase 1: Familiarise yourself with the data

    Transcribe your own interviews if your timetable allows it. Transcription is slow and it is also the single most efficient familiarisation exercise there is — by the end of it you know your data in a way that no amount of later reading recovers. If you used a transcription service or software, read every transcript against the audio at least once, both to catch errors and to hear the tone that plain text loses.

    Then read everything through without coding anything. Keep a separate document for notes: what surprises you, what recurs, what one participant says that flatly contradicts another. These notes are not codes and should not try to be. They are the first sighting of the arguments your analysis will eventually make.

    Expected output: a set of accurate transcripts you have read at least twice, and one or two pages of unstructured observations.

    Phase 2: Generate initial codes

    Now work systematically through the entire dataset and attach a short label to every segment that is relevant to your research question. A code is a compact description of what is interesting in that extract — “reluctance to ask for help”, “describes deadline as external”, “compares self to coursemates” — not a topic heading.

    Three practical rules. Code the whole dataset, not just the quotations you already like; selective coding produces an analysis that confirms what you thought before you started. Let one extract carry more than one code where it genuinely does. And keep the surrounding context attached to each coded extract, because an isolated line loses the meaning that made it interesting.

    Hand coding with coloured pens and margin notes is entirely acceptable at undergraduate level and many students find it faster than learning software mid-project. If you prefer software, use whatever your department supports and can help you with.

    Expected output: a complete coded dataset and a list of codes — typically several dozen for a small undergraduate study — each with the extracts filed against it.

    Phase 3: Search for themes

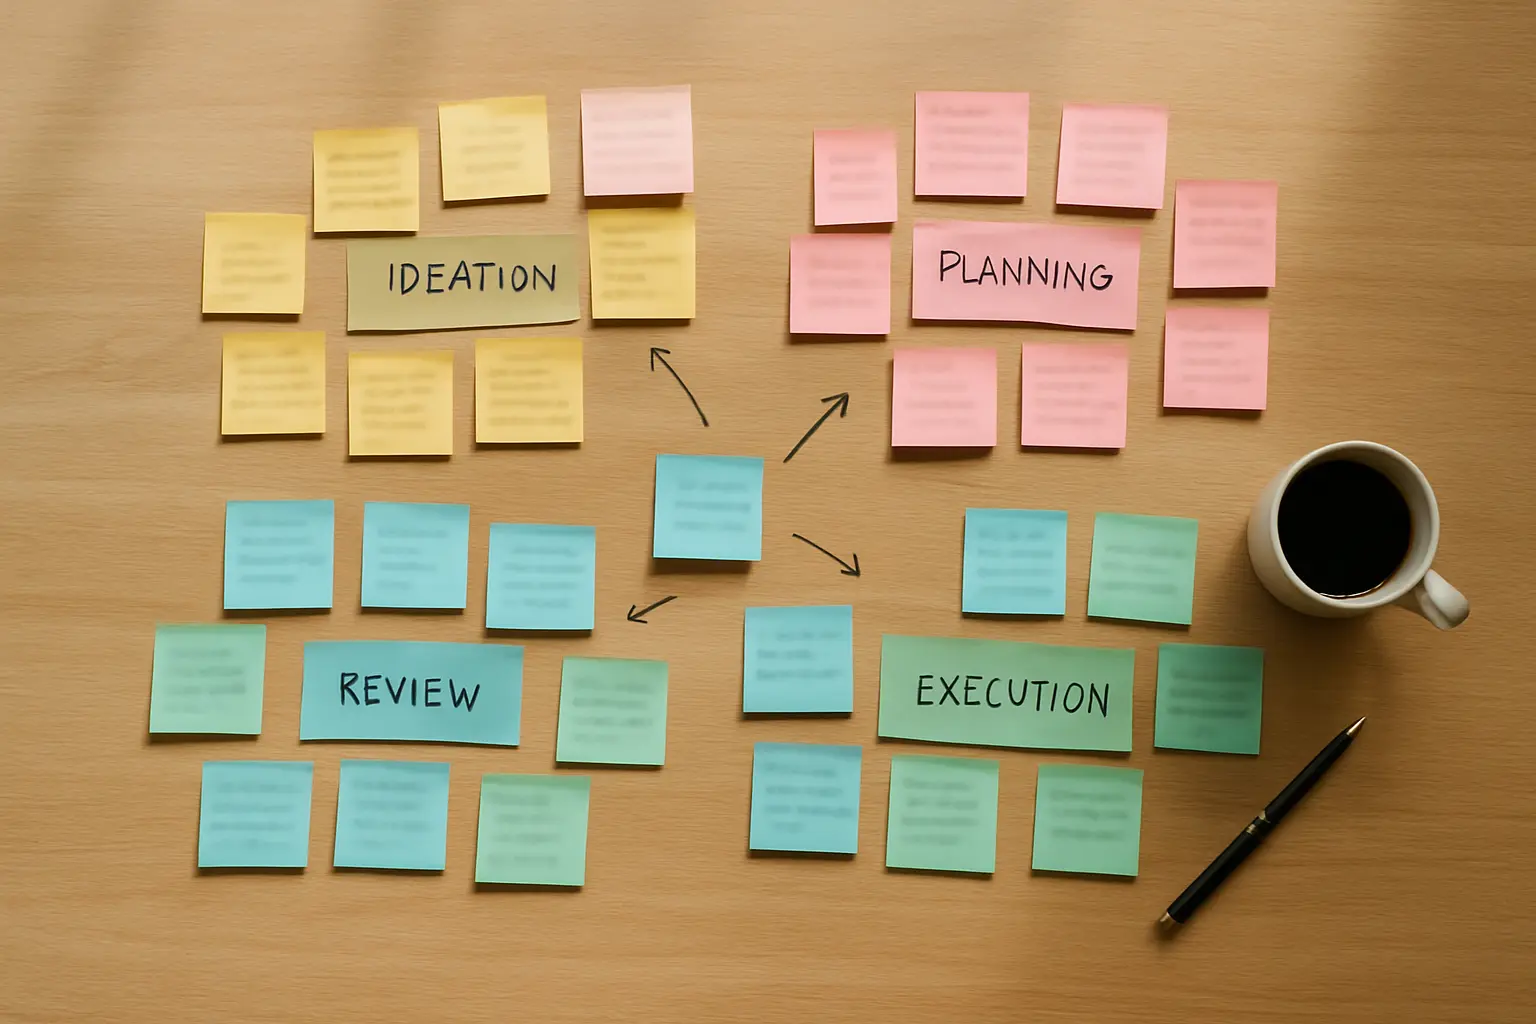
    Collate your codes into candidate themes. This is where sticky notes, a large table and an afternoon beat any piece of software: lay the codes out, move them around, and look for the ones that share an underlying idea rather than a subject matter.

    A theme in reflexive TA is a pattern of shared meaning organised around a central concept. It is not a bucket. Some codes will not fit anywhere and should go into a holding pile rather than being forced; some will turn out to be themes in their own right.

    Expected output: three to five candidate themes with their codes and extracts gathered under each, plus a leftover pile you have not deleted.

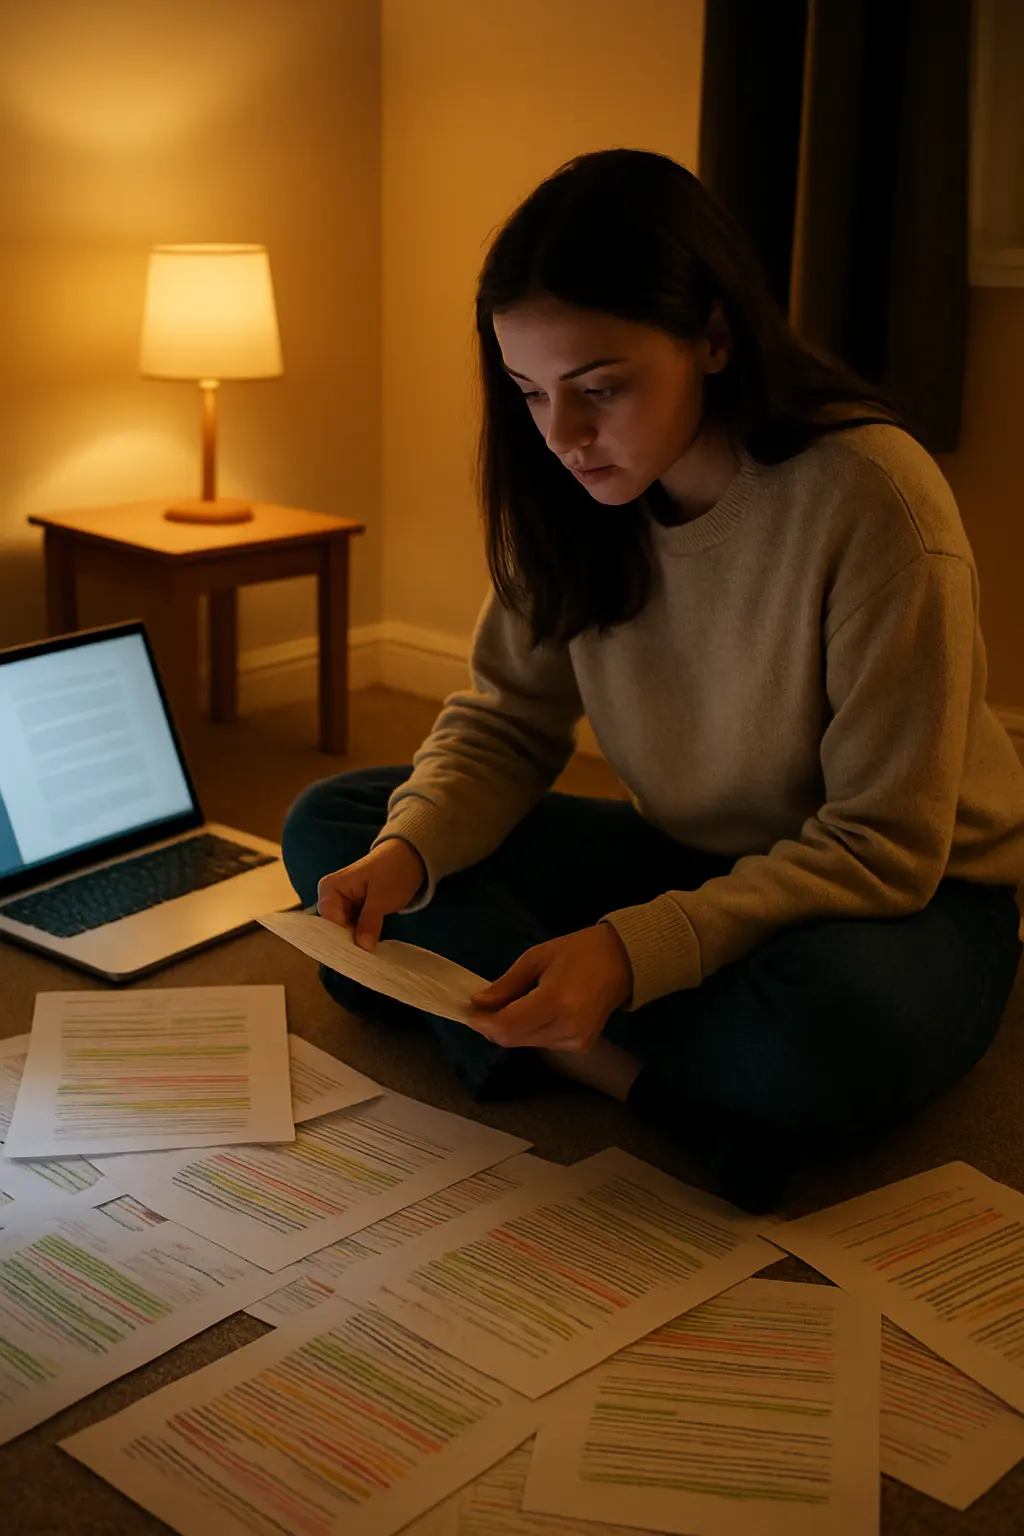
    Colour-coded codes grouped on a table into candidate themes
    Phase three is physical work: codes that share an underlying idea cluster together, and the ones that refuse to cluster are telling you something too.

    Phase 4: Review the themes

    Test your candidates at two levels. First, read all the collated extracts for each theme and ask whether they genuinely form a coherent pattern; if a theme’s extracts pull in two directions, it is probably two themes, and if a theme has four extracts from one participant it is probably that participant’s view rather than a pattern. Second, read your whole dataset again against your thematic map and ask whether the map represents the data as a whole.

    Expect to lose themes here. Collapsing two into one, splitting one into two, and abandoning a candidate that looked promising in phase three are all signs the review is working, not that the analysis is failing.

    Expected output: a revised thematic map you can defend, with any subthemes identified.

    Phase 5: Define and name the themes

    Write a short paragraph for each theme stating what it is about, what aspect of the data it captures, and what it contributes to your research question. If you cannot describe a theme’s scope in a couple of sentences without listing its contents, it is not yet a theme.

    Names should be informative and, where the data supports it, drawn from participants’ own language. “Barriers” tells a reader nothing. “It felt like admitting I could not cope” tells them what the theme argues before they read a word of it.

    Expected output: final theme names and a written definition of each, ready to become the subheadings of your findings chapter.

    Phase 6: Produce the report

    Your findings chapter is the analysis, not a preamble to it. Each theme gets its section; each section makes an argument and uses extracts as evidence for that argument. The prose does the analytical work and the quotations support it — a chapter that is 60 per cent block quotation with a linking sentence between each is a data display, not a findings chapter, and it is marked as one.

    Choose extracts that are vivid and representative, keep them short, and always follow a quotation with your own interpretation of why it matters. Say who each extract came from using your pseudonyms, and never let one talkative participant carry a whole theme.

    Expected output: a findings chapter organised by theme, with interpretation leading and evidence supporting.

    The mistake that costs the most marks: topic summaries

    Braun and Clarke identify confusing “themes-as-meaning-unified-interpretative-stories with themes-as-topic-summaries” as the most common problem in reflexive thematic analysis. It is worth seeing the difference on the page.

    Topic summary (weak) Meaning-based theme (strong)
    Views on workload Workload is described as weather — something that happens to you
    Support from staff Asking for help is read as an admission of not coping
    Use of technology Tools are trusted for facts but not for judgement
    Advantages and disadvantages The cost is accepted because the alternative is unthinkable

    Everything in the left-hand column is a heading under which you could file quotations. Everything in the right-hand column makes a claim that the extracts can support or undermine. The left column produces a chapter that describes what people talked about; the right column produces a chapter that says what your data means. Markers reward the second, and the gap between them is where most of the available marks in a qualitative dissertation actually sit.

    Saturation and second coders: what not to write

    Two conventions from other traditions get imported into student thematic analyses where they do not belong, and both are worth handling explicitly.

    Data saturation. Braun and Clarke question the concept’s usefulness for reflexive TA altogether, on the reasoning that meaning is generated by the researcher rather than waiting in the data to be exhausted. Writing “saturation was reached after seven interviews” in a reflexive TA is a claim your own cited method does not support. The defensible alternative is to justify your sample by your research question, your design and your practical constraints, decided in advance — the same logic set out in our guide to sample size for an undergraduate dissertation.

    Intercoder reliability. Reporting a Cohen’s kappa belongs to coding reliability TA, where accurate coding is a meaningful idea. In reflexive TA there is no single correct coding to agree with, so a kappa value is not rigour, it is a category error. If your department requires a second coder, that is a legitimate instruction — follow it, and then describe your method as coding reliability or codebook TA rather than citing a reflexive source.

    And never write that themes “emerged”. Braun and Clarke explicitly reject language in which themes are “identified, found or discovered”, because it implies they lay in the data independently of you. Themes are generated, created or constructed. Changing that one verb throughout your chapter signals to a marker that you understand the method you named.

    A handwritten reflexive research journal kept alongside a thematic analysis
    A dated journal kept through coding is what turns a reflexivity paragraph from a statement about who you are into evidence of how it shaped the analysis.

    How to write this up in your methodology chapter

    Your methods chapter needs six things: the variant of TA and its citation, whether your coding was inductive or theory-driven, whether you analysed at a semantic or latent level, who coded and how, the software or lack of it, and a reflexivity paragraph. On that last point, Braun and Clarke are unimpressed by “shopping list” identity statements — the paragraph should link your positioning to your actual analytic practice, saying how being a final-year student on the same course as your participants shaped what you noticed, not merely that you were one.

    The chapter’s overall architecture — philosophy, approach, design, sampling, instruments, analysis, ethics — is the same one we set out for writing a methodology chapter, and your analysis section slots into it. Remember too that interviews mean human participants, so your ethics approval had to be in place before you recruited anyone, and your methods chapter should say so. If your project turned out to be literature-based rather than interview-based, thematic analysis is not the tool you need — see literature review versus systematic review instead. And if you are still deciding between a qualitative and a quantitative design, our guide to choosing a statistical test shows what the other route commits you to.

    A realistic schedule

    For eight to twelve interviews, budget roughly a week for transcription and familiarisation, a week for coding, a few days for phases three to five, and two weeks for writing. The phase students consistently underestimate is coding, and the phase they consistently skip is the review — which is unfortunate, because reviewing is where a set of topic headings turns into an argument.

    When the analysis is finished and the chapters need writing, Tesify can structure and draft your dissertation around your own themes and extracts — the interpretation and every word stay 100% yours, with the structure and the bibliography handled.

    Frequently asked questions

    How many themes should a dissertation have?

    There is no rule, but three to five works for most undergraduate projects. Fewer usually means your themes are too broad to say anything; more usually means you have produced topic summaries and are listing subjects rather than making arguments.

    How many interviews do I need for a thematic analysis?

    Decide it in advance from your research question, your design and what you can realistically recruit, and justify that reasoning in your methods. Six to twelve is common for an undergraduate project. Do not justify it by claiming saturation if you are doing reflexive TA.

    What is the difference between a code and a theme?

    A code labels one interesting feature of one extract. A theme is a pattern of shared meaning across the dataset, organised around a central concept, that codes are gathered into. Codes are the raw material; themes are the argument.

    Can I use thematic analysis on open-ended survey responses?

    Yes — it works on any qualitative text, including open-text survey answers, forum posts and policy documents. Short survey responses give you less context per extract, so expect more semantic and less latent analysis.

    Do I need software like NVivo for an undergraduate thematic analysis?

    No. Hand coding is perfectly acceptable and often faster for a small dataset than learning a new package mid-project. Use software if your department teaches and supports it; do not adopt one three weeks from your deadline.

    Should I report inter-rater reliability?

    Only if you are doing coding reliability or codebook TA, where the concept makes sense. In reflexive TA there is no single correct coding, so a kappa statistic is methodologically incoherent. Follow your department’s instruction, and describe your variant accordingly.

    Is it acceptable to say my themes “emerged” from the data?

    Braun and Clarke explicitly reject that language because it implies themes existed independently of the researcher. Write that themes were generated, constructed or developed. It is a small change that markers who know the method notice immediately.

    What is the difference between semantic and latent coding?

    Semantic coding stays with what participants explicitly said; latent coding interprets the assumptions and ideas underneath it. Most dissertations use both. State which you emphasised, because it tells your marker how to read your claims.

    Can I combine thematic analysis with quantitative data?

    Yes, in a mixed-methods design — but analyse each strand with its own appropriate method and be explicit about how you integrate them. Do not count how many participants mentioned each theme and present that as findings; frequency is not what thematic analysis measures.

    What do I do with the codes that did not fit any theme?

    Keep them. They are useful in your discussion as evidence of variation or contradiction, and a marker who sees a leftover pile acknowledged reads it as honesty rather than untidiness. Deleting inconvenient data is the problem; not every code becoming a theme is not.