Tag: reliability

  • Which Statistical Test Should a Sport Science Dissertation Use? (2026)

    Which Statistical Test Should a Sport Science Dissertation Use? (2026)

    Most sport and exercise science dissertations need one of four tests: a paired-samples t test for one group measured twice, a repeated-measures ANOVA for one group measured across several conditions or time points, a mixed ANOVA or ANCOVA for two groups measured before and after an intervention, and Pearson’s r for an association between two performance or physiological measures. The design picks the test; the extra work in this field is reporting reliability and effect size alongside it, because a marker at any BASES-accredited department will ask for both.

    This guide is for UK undergraduate and MSc students in sport and exercise science, strength and conditioning, physiotherapy-adjacent sport rehabilitation and sports coaching. It answers the questions students actually bring to a supervisor in the week the data arrive.

    Why is the statistics question different in sport science?

    Three things separate a sport science dataset from the psychology survey your statistics module was taught on. Samples are small, often eight to fifteen athletes, because testing is physically demanding and time-limited. Designs are mostly within-participant, with each athlete acting as their own control across conditions or sessions. And the outcomes are measurements from equipment (force plates, gas analysers, timing gates, lactate analysers) whose reliability is part of the finding rather than an assumption. The generic decision tree in our guide to choosing a statistical test for a psychology dissertation still applies; what changes is which branches you use most and what you must report around the test.

    Dr Nic on the three questions that choose a test; the sport science designs below are the branches you will use most.

    Is your hypothesis a difference or an association?

    Write the hypothesis as a sentence. If it says one condition, group or time point will differ from another on a measure, you need a test of difference. If it says two measures move together across athletes, you need a correlation or regression. Almost every undergraduate sport science project is a test of difference with a repeated-measures element, which is why the rest of this guide leans that way.

    Which test for one group measured before and after?

    A single group tested at baseline and again after a training block, supplement or warm-up protocol is a paired-samples t test on the change. If the differences are not approximately normal, which is common with eight participants, the Wilcoxon signed-rank test is the fallback, and the honest sentence is that you used it because the difference scores were skewed. Report the mean change with its 95% confidence interval, not just the p value: a marker can read a confidence interval on a change in countermovement-jump height as a finding; a bare p value tells them nothing about size.

    Which test for two groups measured before and after?

    An intervention group and a control group, both tested pre and post, is the design where most sport science dissertations choose the wrong test. Running two separate paired t tests and declaring that one group improved significantly and the other did not is not a comparison between the groups. The two defensible options are:

    • Mixed ANOVA (one between-participant factor, group; one within-participant factor, time), where the finding is the group-by-time interaction, not the main effects.
    • ANCOVA on the post-test score with the baseline as a covariate, which Vickers and Altman showed in the BMJ in 2001 is generally the more powerful analysis for controlled designs with baseline and follow-up measurements, and which handles baseline imbalance between small groups better than a change-score comparison.

    Either is acceptable at undergraduate level; choose one before you see the data and say why.
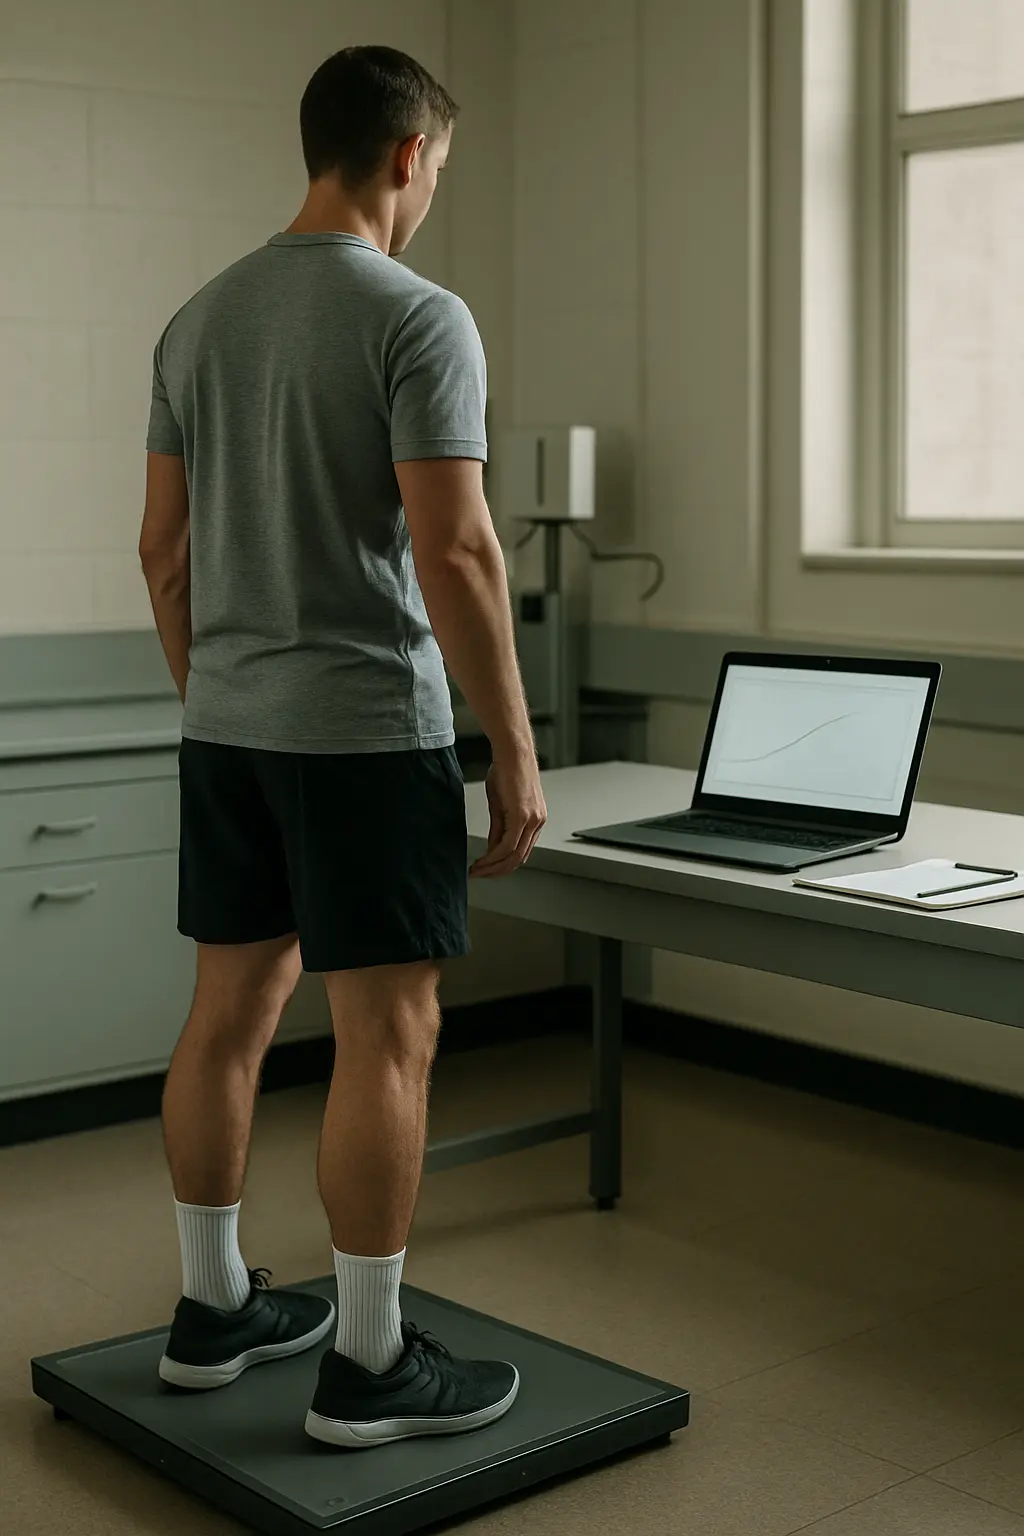
    An athlete on a force plate in a university sport science laboratory with a laptop recording the trial
    Each athlete is usually their own control, which is why repeated-measures designs dominate this field and why their assumptions matter.

    Which test for a crossover or several conditions?

    The same athletes completing two conditions, caffeine and placebo, cool and hot, compression garment and none, in a counterbalanced order is a crossover. Two conditions on one outcome is a paired-samples t test. Three or more conditions is a one-way repeated-measures ANOVA with post-hoc pairwise comparisons corrected for multiple testing, most often Bonferroni. Two things need a sentence in the methods: how the order was counterbalanced or randomised, and how long the washout was, because an order effect is the most common threat to a crossover and markers look for it.

    Which test when you measured at several time points in each condition?

    Blood lactate at rest, five, ten and fifteen minutes, in two conditions, is a two-way repeated-measures ANOVA with condition and time as within-participant factors. The finding you want is the condition-by-time interaction. This is also the design in which sphericity fails most often: report Mauchly’s test, apply the Greenhouse–Geisser correction when it is violated, and say so in the results. Where the field is starting to prefer linear mixed models for this design, an undergraduate is not expected to run one, but noting the limitation in the discussion reads well.

    How do you report reliability, and why does it carry marks?

    In sport science the measurement itself is a result. If your outcome is a sprint time or a peak power value, the marker wants to know how much of any change is measurement noise. The standard reference is Will Hopkins’ 2000 paper in Sports Medicine, which sets out three measures for a test–retest study:

    1. Typical error of measurement, the within-participant standard deviation between trials, usually expressed as a coefficient of variation in per cent for measures on a ratio scale.
    2. Intraclass correlation coefficient, the test–retest reliability of rank order between athletes, reported with its confidence interval and with the ICC model stated.
    3. Limits of agreement from Bland and Altman’s 1986 Lancet method, with the bias and the plot, when you are comparing two instruments or methods rather than two trials.

    If your project did not include a test–retest, cite the published reliability for the protocol and equipment you used and state the typical error you are assuming. A change smaller than the typical error is not a change, and saying so in the discussion is worth more marks than any p value. The same logic underlies the internal-consistency reporting explained in our guide to acceptable Cronbach’s alpha values for questionnaire-based projects.

    What effect size should a sport science dissertation report?

    Cohen’s d (or Hedges’ g for small samples) for differences, partial eta squared for ANOVA effects, and r for associations. Two scales are in circulation and you should name the one you use. Cohen’s conventions of .20, .50 and .80 for small, medium and large are the general-purpose ones. The sport-science-specific thresholds proposed by Hopkins and colleagues in their 2009 Medicine and Science in Sports and Exercise paper on progressive statistics set 0.2, 0.6, 1.2 and 2.0 for small, moderate, large and very large, and add the idea of the smallest worthwhile change, conventionally 0.2 of the between-athlete standard deviation, as the threshold a practical intervention must clear. Report the effect size with a confidence interval, and interpret it against a named scale.
    A printed results table with effect sizes and confidence intervals annotated in pen beside a sports timing gate
    Effect size with a confidence interval, interpreted against a named scale, is the sentence that turns a sport science result into a finding.

    Should you use magnitude-based inference?

    Not as your primary analysis. Magnitude-based inference, the approach that reports the probability an effect is beneficial, trivial or harmful, was widely used in sport science journals through the 2010s and still appears on reading lists. Kristin Sainani’s 2018 paper in Medicine and Science in Sports and Exercise, and Welsh and Knight’s statistical review in the same journal in 2015, showed that it produces inflated false-positive rates compared with conventional inference. An undergraduate dissertation that uses MBI as its only inferential method invites a question in the viva or feedback that is hard to answer. If your supervisor works in that tradition, run the conventional test and confidence interval first and present the MBI interpretation as supplementary.

    What sample size can you defend with eight athletes?

    Within-participant designs are more powerful than between-participant ones for the same number of people, which is why small crossover studies are publishable. But eight participants still detects only large effects, so state the effect size your design could detect at 80% power, using G*Power or the published typical error of your outcome, and treat any non-significant result with a large effect size as underpowered rather than null. The general argument, and the published rules of thumb it replaces, is in our guide to sample size for an undergraduate dissertation.

    What do you do when the assumptions fail?

    Small sport science samples fail normality and sphericity checks routinely. The fallback is a named non-parametric alternative for the simple designs (Wilcoxon, Friedman) and a correction (Greenhouse–Geisser) for the factorial ones, reported with a sentence explaining why. The full map of what each failed assumption means and what to do about it is in our guide to what to do when your statistical assumptions fail.

    The table: design to test

    Design Example Parametric test Non-parametric or correction Effect size
    One group, pre and post Jump height before and after six weeks of plyometrics Paired-samples t test Wilcoxon signed-rank Cohen’s d for paired data
    Two groups, pre and post Intervention vs control on 5 km time Mixed ANOVA or ANCOVA with baseline covariate Rank-based ANCOVA (rare at UG level) Partial eta squared or adjusted mean difference with CI
    Crossover, two conditions Caffeine vs placebo on time to exhaustion Paired-samples t test Wilcoxon signed-rank Cohen’s d
    Crossover, three or more conditions Three warm-up protocols on sprint time One-way repeated-measures ANOVA Friedman test Partial eta squared
    Condition by time Lactate at four time points in two conditions Two-way repeated-measures ANOVA Greenhouse–Geisser correction Partial eta squared for the interaction
    Two independent groups Forwards vs backs on Yo-Yo test Independent-samples t test Mann–Whitney U Cohen’s d or Hedges’ g
    Association Squat 1RM and 20 m sprint time Pearson’s r Spearman’s rho r with CI
    Test–retest reliability Two sessions on the same force plate ICC, typical error, CV% Bland–Altman limits of agreement Not applicable

    Which software should you use?

    SPSS runs everything in the table and is what most UK sport science departments teach; jamovi runs the same set free of charge and is the sensible choice if your campus licence lapses over the summer; R is the long-term investment. The trade-offs, and what happens to each when your university access ends, are compared in our guide to SPSS versus R versus jamovi. Whichever you use, the reporting sentence is the same: test, degrees of freedom, statistic, exact p, effect size with confidence interval, and, for a performance measure, the change against the typical error.

    Where students lose marks on this section

    Not on the test. On three sentences that are missing: the one that justifies the design-to-test choice, the one that reports reliability of the measure, and the one that interprets the effect size against a named scale and the smallest worthwhile change. If the analysis is done and the results and methods sections are the blank part, Tesify can draft both from your own design, your own output and your own reliability figures, so the reasoning stays yours and the chapter stops being the bottleneck. Every sentence is 100% written by you; what you get is structure and momentum.

    Frequently asked questions

    Which statistical test is most common in a sport science dissertation?

    The paired-samples t test and the repeated-measures ANOVA, because most designs measure the same athletes more than once. Between-group tests and correlations are the next most common, and reliability statistics appear alongside whichever test you run.

    Can I run two paired t tests instead of a mixed ANOVA?

    No. Showing that one group changed significantly and the other did not is not a test of whether the groups differed. Use a mixed ANOVA and report the interaction, or an ANCOVA on the post-test with baseline as a covariate.

    What is a typical error of measurement?

    The within-participant standard deviation between repeated trials on the same test, usually expressed as a coefficient of variation in per cent. Hopkins’ 2000 paper defines it, and a change smaller than the typical error should not be described as a change.

    Do I need to report an ICC?

    If you ran a test–retest, yes, with its confidence interval and the ICC model used. If you did not, cite the published reliability of the protocol and equipment and state the typical error you are assuming.

    Should I use Cohen’s effect-size scale or Hopkins’ scale?

    Either, but name it. Cohen’s conventions are general purpose; Hopkins and colleagues’ 2009 thresholds were proposed for sport science and add the smallest worthwhile change. Interpreting an effect against a scale you do not name is the error markers see most.

    Is magnitude-based inference acceptable in a dissertation?

    Only as a supplement. Published critiques in 2015 and 2018 showed inflated false-positive rates, so run the conventional test and confidence interval first and present any MBI interpretation as additional.

    What if my sample is only eight athletes?

    Common and defensible for a within-participant design, provided you state the effect size the study could detect at 80% power and interpret non-significant results with large effect sizes as underpowered rather than null.

    What should I do if sphericity is violated?

    Report Mauchly’s test and apply the Greenhouse–Geisser correction to the degrees of freedom, saying so in the results. It is the expected response, not a problem.

    Do I need to report reliability if I used published equipment?

    Yes, at least by citation. State the published typical error or ICC for the protocol on the equipment you used, and compare your observed changes to it in the discussion.

  • What Is an Acceptable Cronbach’s Alpha for a Dissertation? (2026)

    What Is an Acceptable Cronbach’s Alpha for a Dissertation? (2026)

    There is no single acceptable value. The convention is that alpha of .70 or above is adequate, but that figure comes from Nunnally’s advice for the early stages of research; he recommended .80 for basic research and .90 as a minimum where important decisions rest on individual scores. For an undergraduate dissertation using an established scale, .70 to .95 is the defensible range — and you must interpret the number, not just report it.

    That is the honest answer, and it is more useful than a threshold, because markers rarely penalise a modest alpha that has been discussed intelligently and frequently penalise a high one that has been pasted in without comment. Here is what the coefficient is doing, what it cannot do, and how to write it up.

    What does Cronbach’s alpha actually measure?

    It estimates internal consistency: the extent to which the items in one scale correlate with each other, and so appear to be tapping the same underlying construct. If your six questions about workplace stress genuinely hang together, people who score high on one will tend to score high on the others, and alpha will be high.

    Two things follow that students routinely get wrong. Alpha is a property of the scores from your sample, not a permanent property of the instrument — which is why you report your own alpha even for a well-established scale rather than quoting the original authors’. And alpha is about consistency, not accuracy: a scale can be highly consistent and consistently measure the wrong thing.

    Where did the .70 rule come from, and what did Nunnally really say?

    Almost every dissertation that justifies a threshold cites Jum Nunnally’s Psychometric Theory (2nd edition, 1978). Very few quote him. He wrote, at pages 245–246:

    “what a satisfactory level of reliability is depends on how a measure is being used. In the early stages of research … one saves time and energy by working with instruments that have only modest reliability, for which purpose reliabilities of .70 or higher will suffice. … In contrast to the standards in basic research, in many applied settings a reliability of .80 is not nearly high enough. In basic research, the concern is with the size of correlations and with the differences in means for different experimental treatments, for which purposes a reliability of .80 for the different measures is adequate. In many applied problems, a great deal hinges on the exact score made by a person on a test. … In those applied settings where important decisions are made with respect to specific test scores, a reliability of .90 is the minimum that should be tolerated, and a reliability of .95 should be considered the desirable standard.”

    Read that in full and the familiar rule inverts. Nunnally offers .70 as a concession for exploratory work, treats .80 as the ordinary standard for basic research, and reserves his real severity for applied decisions. The point he was making is that .70 is not usually sufficient and that we should be working to a considerably higher standard most of the time.

    This misreading is not a private observation. Lance, Butts and Michels traced four widely repeated cutoff criteria back to their original sources in Organizational Research Methods (2006, volume 9, issue 2, pages 202–220) and found that the sources did not say what they are routinely cited as saying. Citing “Nunnally (1978)” for a flat .70 threshold is citing a source against its own argument — and it is the kind of thing a well-read marker enjoys pointing out.

    The practical move for your dissertation is not to panic but to be precise: state the value you obtained, say what standard you are judging it against and why that standard fits your purpose, and cite honestly.

    Does a higher alpha always mean a better scale?

    No, and this is the second thing markers look for. Alpha is a function of the average correlation between items and the number of items. Add more items saying roughly the same thing and alpha rises even if the average inter-item correlation stays modest — a point Cortina made directly in Journal of Applied Psychology (1993, volume 78, issue 1, pages 98–104).

    So a twenty-item scale reporting alpha of .92 may be less impressive than a five-item scale reporting .78. And a very high alpha, above roughly .95, is usually a warning rather than a triumph: it suggests item redundancy, that you have asked the same question five times in slightly different words. Redundant items lengthen your questionnaire, increase drop-out, and add nothing.

    Alpha Conventional description What to actually think
    Below .60 Unacceptable Do not compute a total score from these items; investigate why
    .60–.69 Questionable Reportable with discussion; treat findings from the scale cautiously
    .70–.79 Acceptable Fine for exploratory undergraduate work; Nunnally’s floor, not his standard
    .80–.89 Good The ordinary target for a basic-research design
    .90–.94 Excellent Required where decisions about individuals rest on the score
    .95 and above “Better still” Check for redundant items before celebrating

    Descriptive labels like these circulate widely and vary between textbooks. Taber’s review of how alpha is used and described in science education research (Research in Science Education, 2018, volume 48, issue 6, pages 1273–1296) documents just how inconsistently the same numbers get labelled across published studies. Use the table as orientation, and let your discussion, not the adjective, carry the argument.

    A printed Likert-scale questionnaire being completed by a participant
    Alpha describes how your respondents answered these items — not a fixed property of the questionnaire itself.

    Does a good alpha prove my scale measures one thing?

    No. This is the most consequential misunderstanding of the coefficient. Alpha is not a test of unidimensionality, and a multidimensional set of items can produce a perfectly respectable alpha. If your scale has established subscales, compute alpha separately for each subscale as well as for the total, and say so. Demonstrating that items form a single dimension requires factor analysis, not a reliability coefficient.

    Should I delete items to raise my alpha?

    Sometimes, carefully, and always transparently. Your reliability output gives you two diagnostics: the corrected item-total correlation, which is the correlation between each item and the scale score computed without that item, and the alpha-if-item-deleted value. An item with a very low corrected item-total correlation, whose removal raises alpha above the full-scale value, is a genuine candidate for deletion.

    Three cautions. Check first that you reverse-scored every negatively worded item before running the analysis — a forgotten reverse-score is the most common cause of a mysteriously terrible alpha and of one item that looks catastrophic on its own. Do not strip a validated scale down to whatever maximises alpha, because you then no longer have the instrument you cited and cannot claim its published validity evidence. And report every deletion, with the reason and both alpha values, rather than quietly presenting the improved figure.

    What should I do if my alpha is low?

    Diagnose before you despair. Reverse-scoring errors come first. Then check whether one item was ambiguously worded or interpreted differently by your participants, whether the scale was written for a different population from yours, and whether your sample is simply small — alpha estimated from thirty responses is unstable, and your justification for that number should already be in your methods, as we set out in our guide to sample size for an undergraduate dissertation.

    If it stays low, report it and discuss it. Low reliability attenuates correlations, pulling them towards zero, which means it makes you less likely to find a significant relationship rather than more — so a low alpha alongside a non-significant result is a limitation worth stating explicitly, because it is a plausible reason the effect did not appear. A limitations section that identifies that mechanism reads as competence. A silently reported .54 reads as something else.

    A published scale's item list being checked against a dissertation questionnaire
    If you shortened or reworded a validated scale, its published reliability evidence no longer transfers — you are reporting on a new instrument.

    Should I use McDonald’s omega instead?

    There is a real methodological argument that you should. Alpha rests on assumptions — notably that all items relate equally strongly to the underlying construct — that real scales frequently violate, and McDonald’s omega relaxes them. Hayes and Coutts made the case directly in a paper titled “Use Omega Rather than Cronbach’s Alpha for Estimating Reliability. But…” (Communication Methods and Measures, 2020, volume 14, issue 1, pages 1–24), and the trailing “But…” is doing real work: they qualify the recommendation rather than issuing it flatly.

    For an undergraduate dissertation the sensible position is that alpha remains the expected convention and is what most UK departments teach. Report omega alongside it if your software gives it to you easily and you can explain what it is; do not substitute a coefficient you cannot define. A marker asking “why omega?” and receiving a confident answer is a good moment. Receiving silence is not.

    How do I report alpha in my dissertation?

    In the methods chapter, name the scale, its source, the number of items and the response format. In the results, give alpha for your own sample to two decimal places, with a leading zero omitted in APA style: α = .84. Report each subscale separately where subscales exist. If you deleted items, say which and why, and give alpha before and after.

    A worked sentence you can adapt: “Internal consistency for the six-item scale was good in the present sample (α = .84), comparable to the .87 reported by the scale’s authors. One item was retained despite a low corrected item-total correlation (.19) because removing it would have departed from the validated instrument; alpha excluding that item would have been .88.”

    That sentence does everything a marker wants: it reports, it compares, it makes a decision, and it justifies the decision. The wider architecture it sits inside — design, sampling, instruments, analysis — is set out in our guide to writing a methodology chapter, and the reliability run itself is a couple of clicks in whichever package your course uses, compared in SPSS vs R vs jamovi.

    Reliability is only half the picture, too. Once you know your scale is consistent, the analysis question is which test its scores belong in — see choosing the right statistical test. If your project turned out to be qualitative instead, reliability coefficients do not transfer at all; the equivalent quality debate is covered in our guide to doing a thematic analysis.

    When the analysis is settled and the writing is the bottleneck, Tesify can structure and draft your dissertation around your own results — every word still written by you, with the structure and bibliography handled.

    Frequently asked questions

    Is 0.7 a good Cronbach’s alpha?

    It is conventionally described as acceptable, and it is adequate for exploratory undergraduate work. But .70 was Nunnally’s figure for the early stages of research, not his general standard — he treated .80 as adequate for basic research. Report .70 with a sentence of discussion rather than presenting it as a pass mark.

    What if my Cronbach’s alpha is 0.6?

    Report it, investigate it and discuss it. Check reverse-scoring first, then item wording and sample size. You can still use the scale if you are explicit about the limitation and cautious in your conclusions, and the attenuation argument gives you something intelligent to say about any non-significant results.

    Can Cronbach’s alpha be too high?

    Yes. Above about .95 the usual cause is redundant items asking the same question repeatedly. That is a design weakness rather than a strength, and it is worth a line in your discussion.

    Do I report alpha for the whole scale or each subscale?

    Both, when the instrument has established subscales. A respectable total-scale alpha can hide a weak subscale, and reporting only the total looks like concealment even when it is not.

    Do I need to calculate alpha if I used a published validated scale?

    Yes. Alpha describes your data, not the instrument in the abstract, and reliability varies by sample and population. Report your own value and compare it with the published one — a sentence that does both is stronger than either alone.

    Can I use Cronbach’s alpha with a two-item scale?

    It is not informative with two items. Report the correlation between the two items instead, and say why. Alpha’s dependence on item count makes it a poor summary for very short scales.

    Does alpha apply to a scale I wrote myself?

    You can compute it, but a good alpha on a self-written scale demonstrates only internal consistency, not that the scale measures what you claim. Expect a marker to ask about validity, and prefer an established instrument wherever one exists.

    Is Cronbach’s alpha the same as validity?

    No. Reliability is consistency; validity is whether the instrument measures the intended construct. A scale can be reliably wrong. Your methods chapter should address both, and they need different evidence.

    Do I need alpha for a single-item measure?

    No — internal consistency has no meaning for one item. Single-item measures are acceptable for some constructs, such as a straightforward demographic or a global rating, but you should say why one item was sufficient.

    How do I write alpha in APA style?

    Use the Greek letter with no leading zero, italicised, to two decimal places: α = .84. Put it in the results text or in a table of scale statistics, and keep the format consistent throughout the dissertation.